Key Takeaways
- Hyperspectral imaging (HSI) satellite data collected before a fire can effectively identify areas at higher risk of severe fire impacts.
- HSI data provide valuable insights into fire behavior and the resulting impact on both natural and human-built environments.
- During and post-fire, HSI data facilitates the remote mapping of fire severity, perimeter, and unburned areas, particularly in regions where ground-based observation is not possible.
- Our findings underscore the importance of continuous monitoring of vegetation health and fire risk, particularly in areas vulnerable to wildfire.
Before the Fires: Signs of Vulnerability
In November and December 2024, Orbital Sidekick (OSK) captured a series of HSI data over Eaton Canyon. It was during our recent analysis of this data that we discovered a concerning trend: vegetation on the south-facing slopes, closer to Altadena, appeared significantly drier and less healthy than that on the north-facing slopes. This isn't surprising, as the south-facing slopes receive more direct sunlight, leading to increased drying and potentially harsher conditions for plant life.
Examining the fire perimeter data from CAL FIRE, we observed a strong connection between the areas that burned in the Eaton Fire and the regions where pre-fire imagery indicated less healthy vegetation. While other factors, such as existing fire breaks and infrastructure, undoubtedly played a role in the fire perimeter, the correlation with pre-fire vegetation health is striking.


Caption: a) Map of the Optimized Soil Adjusted Vegetation Index (OSAVI) on OSK data, illustrating the difference in vegetation health between north- and south-facing slopes before the Eaton Fire. Healthier vegetation is depicted by darker blue. The fire burn perimeter is outlined in orange. b) Comparison of spectral signatures from OSK imagery taken from forested pixels within the Eaton Fire perimeter and outside the fire perimeter, as well as green, healthy vegetation in the image (from a golf course).
After the Fires: Assessing Damage with HSI
HSI provides a powerful tool for high-fidelity mapping of fire impacts. OSK generated a suite of analytical products related to burn severity and vegetation health, which were subsequently analyzed in conjunction with the CAL FIRE fire perimeter and Damage Inspection (DINS) database, a record of structural damage within the fire perimeter. The derived Normalized Burn Ratio (NBR), utilizing HSI shortwave infrared (SWIR) bands, demonstrated a near-perfect correlation with the Palisades Fire perimeter data. Furthermore, analysis of an RGB composite derived from the HSI data revealed a strong correlation with the extent of damage to man-made structures within the Palisades burn area.

Caption: Normalized Burn Ratio (NBR) derived from OSK imagery, illustrating a near-perfect correlation with the Palisades Fire perimeter data published by CAL FIRE. Unburned areas are depicted in blue, while burned areas are shown in brown. The fire burn perimeter is outlined in orange.

Caption: RGB composite of OSK analytical products overlaid with the DINS database identifying structural damage from the Palisades Fire. Purple hues indicate areas of significant fire impact, while green hues represent less affected regions. The orange rectangle indicates the location shown in the following figure.
Interestingly in the Palisades Fire area, we observed several south-facing slopes that retained vegetation despite the fire. This contrasts with the Eaton Fire region and may be attributed to the coastal influences in the Palisades area. We verified this observation by comparing our results with high-resolution imagery that Maxar acquired after the fire. HSI data can be successfully used to map fire severity, perimeter, and remaining unburned areas, particularly in remote regions.
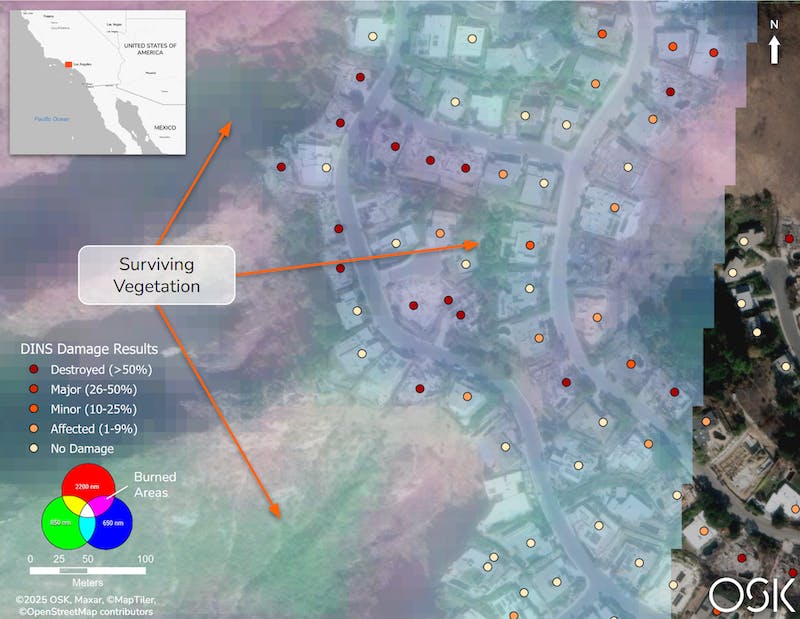
Caption: RGB composite identifying fire-impacted areas in the Palisades region overlaid on Maxar post-fire imagery. Structural damage is identified with the DINS data. Areas of surviving vegetation are denoted with arrows. Purple hues indicate areas of significant fire impact, while green hues represent less affected regions. Basemap imagery: MAXAR, © MapTiler, © OpenStreetMap contributors
About the Authors
Dr. Jennifer Buz is the Principal Remote Sensing Scientist at OSK. Prior to OSK she worked primarily on geology related projects using hyperspectral data from satellites orbiting Mars. At OSK, she focuses on vegetation related projects including fire risk assessment, vegetation health assessment, and speciation. She is leading the OSK XPrize Ending Destructive Wildfires competition team. She also continues to work on geology and mineralogy projects at OSK for mining exploration and monitoring applications.
Dr. Sarah Power is a Remote Sensing Scientist at Orbital Sidekick focusing on hyperspectral image analysis across diverse applications, including vegetation monitoring, wildfire risk and impact assessment, and land disturbance detection. She applies machine learning algorithms and other modeling techniques to transform complex remote sensing data into valuable insights. Previously in her graduate studies, she researched photosynthetic microbial communities in Antarctic streams and soils using multispectral satellite imagery.
Alicia Williams is a Senior Sales Engineer at Orbital Sidekick specializing in developing hyperspectral imagery solutions for complex customer challenges. Her expertise lies in geospatial analysis and remote sensing, where she leverages novel technologies to unlock valuable insights for clients across various industries. Passionate about using technology to drive positive environmental and social impact, Alicia is a frequent contributor to industry conferences and publications.