Introduction
The most common greenhouse gas emitted through human activities, carbon dioxide (CO2), is consumed by plants during photosynthesis (the C from CO2 is stored in plant matter while the O returns to the atmosphere as breathable oxygen (O2)). This natural process is actively being harnessed by companies wishing to offset their carbon dioxide emissions. For example, companies can purchase protections for vegetated land due-to-be clear cut or purchase barren land for reforestation. Therefore, by actively preventing the destruction/decay of plant matter, or by introducing more plant matter (reforestation), a company can theoretically offset some of their emissions.
One of the biggest issues in the carbon credit market is validating and verifying carbon offsets. There is a need for a system that can accurately and frequently ensure that the areas sold for carbon credits have the vegetation mass (and therefore for carbon offset capability) they claim, and that these areas maintain that mass by ensuring the vegetation’s health. Traditional techniques for measuring vegetation mass and determining health are costly and require many person-hours. The Analytics team at OSK is actively working to develop an alternative approach that accurately quantifies mass and assesses health through satellite hyperspectral imagery, a technique which enables us to remotely identify material composition (including plant species) and condition (e.g., health and growth stage).
How much carbon a plant is capable of storing ultimately is tied to many factors including density (primarily species dependent), size, and health (trees that are actively decaying are not effectively storing carbon). Consequently, to accurately determine carbon mass, an inventory of the major plants in a carbon credit area (including species, size, and health), must be generated. OSK will monitor these areas by obtaining high resolution hyperspectral imagery of vegetative systems via their GHOSt (Global Hyperspectral Observation Satellite) constellation. With the added benefit of weekly-to-monthly revisits, this constellation makes an ideal system for carbon credit area monitoring. This article will focus specifically on the problem of determining plant species through satellite data, an important step in determining the amount of CO2 that can be sequestered. Upcoming articles will detail plant size determinations and ultimately how both species and size feed into carbon mass estimates.
Datasets
To build a species classification model, we matched pixels in our remote sensing imagery to plants on the ground for which we know the species. To accomplish this, we collaborated with the researchers at the Teakettle Experimental Forest who graciously provided us with a map of their study area which included the GPS coordinates, species, health, and trunk size of each tree. Our remote sensing data comes from our airborne “Kato” sensor (a near-replica of the imager which will be on GHOSt) which flew over the study area and acquired hyperspectral imagery (400-2500 nm, 472 bands) at ~0.5 m/pixel resolution. In addition, we acquired point spectrometer reflectance measurements of each species on the ground (250-2500 nm at 1nm resolution). A mosaic of the Kato data over Teakettle as well as an on-the-ground photo of the forest are shown below.
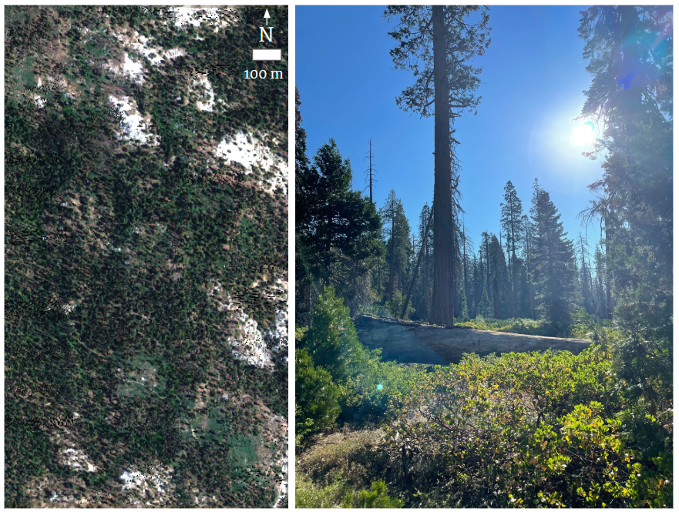
Left: True-color mosaic of Kato data over the Teakettle Experimental Forest
Right: Photo on the ground at Teakettle showing species diversity
Technology
Coverage of the entire teakettle experimental forest required capturing dozens of individual hyperspectral images. In order to combine these images into a mosaic we accounted for potential variations of atmospheric conditions throughout the data collection. To do this, we ran an open source atmospheric correction routine called ISOFIT1 (Imaging Spectrometer Optiman FITting) which converted all of our remote sensing data from radiance to reflectance. These reflectance measurements were compared to the ground-acquired point spectrometer data for quality assurance.
A database of reflectance spectra for each of the tree species within the study area was acquired using the Teakettle stem map and the geo-referenced hyperspectral images. We used an open-source python machine learning library to compare several models and determine whether our spectral data could distinguish the various species present. Identifying the species present within a pixel has the added (future) benefit of allowing characterization of that plant’s health and growth stage. This is because minute differences in the visible near-infrared reflectance due to growth stage and health can be confounded by similar changes that occur between species.
Results
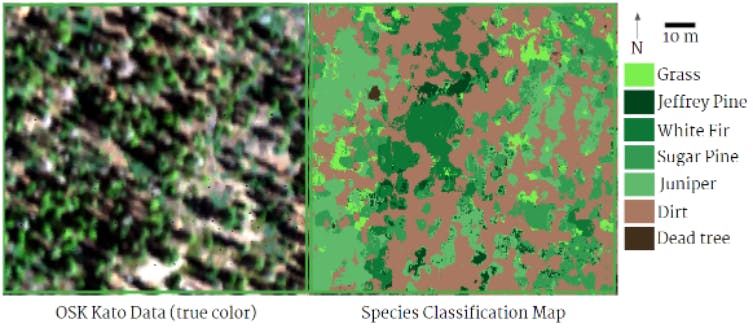
We found that a wide variety of machine learning classifiers (such as nearest neighbors and random forest) were able to identify the species within our images with high (>95%) accuracy. An example classification map over one portion of the Teakettle Experimental Forest is shown below.
Concluding Statement
For the most robust quantification of carbon mass, and the best assessment of the health of a vegetated area, speciation is critical. Through the use of high resolution hyperspectral data, ground-truth databases, and complex analytical techniques we are able to determine the species present within a pixel to a high degree of accuracy. These species identifications will feed directly into our carbon mass model.
For more information, or if you want to discuss our work, please reach out to us at info@orbitalsidekick.com

Jennifer Buz is the Principal Remote Sensing Scientist at Orbital Sidekick. Her expertise includes image processing and spectroscopy. Prior to OSK, Jennifer used a variety of satellite datasets to investigate planetary science mysteries such as what makes Mars' crust magnetic. Jennifer holds a PhD in Planetary Geology from Caltech and Bachelors and Masters degrees in Planetary/Geosciences from MIT. In her free time Jennifer enjoys at-home science experiments, reading, volunteering, and recreating in the great outdoors of Northern Arizona.
References
1 Thompson, David R., Brodrick, Philip G., Olson-Duvall, Winston, Carmon, Nimrod, Bohn, Niklas, Shiklomanov, Alexey, Serbin, Shawn P., Fahlen, Jay, Erickson, Adam, & McGibbney, Lewis J. (2022, July 26). ISOFIT - Imaging Spectrometer Optimal FITting (Version v2.9.3). Zenodo. https://doi.org/10.5281/zenodo.6908949.